
What to Know
- Thirty years have passed since the Jan. 17, 1994 Northridge earthquake.
- The early morning earthquake was centered in SoCal's San Fernando Valley, but shaking was felt throughout the region.
- In the years since, the threat of earthquakes remains part of living in Southern California, but there have been significant changes in safety, research and technology.
In the three decades since the Jan. 17, 1994 Northridge Earthquake, there has been a push toward progress -- sometimes frustratingly slow -- on everything from safer buildings and early warnings to increasing society's overall ability to deal with seismic threats and react in those first uncertain moments of shaking.
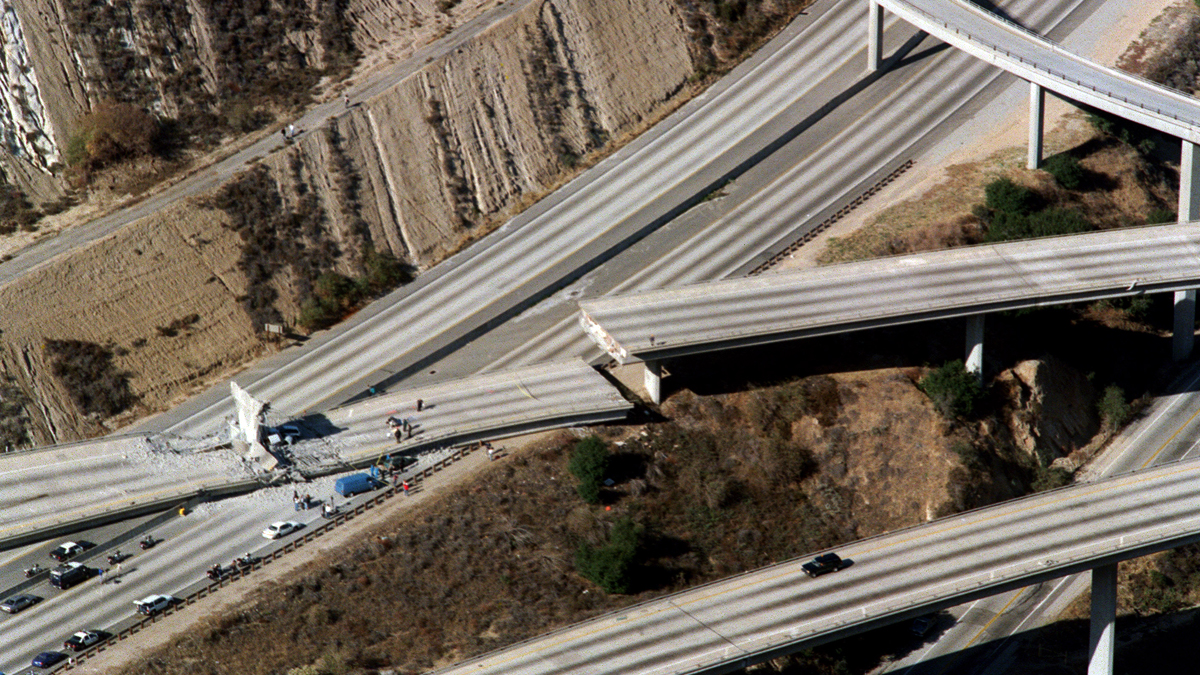
The Northridge Earthquake led to more than 60 deaths, destroyed 50,000 housing units and started about 500 fires. More than 9,000 people were injured and 20,000 were displaced in a natural disaster that caused an estimated $20 billion in damage. The destruction included collapsed buildings and freeway overpasses, snapped water and gas lines, widespread power outages and landslides.
Get Southern California news, weather forecasts and entertainment stories to your inbox. Sign up for NBC LA newsletters.
Significant changes in technology and how it's used and our understanding of the safety threat from earthquakes arrived in the years that followed.
"It really was night and day, the impact on seismic monitoring," said USGS seismologist Susan Hough. "In 1994, it was a struggle to locate the epicenter of the earthquake. Was it in Reseda? Was it in Northridge? What fault was it on? And, to get the magnitude. That took some time. That experience directly spurred major improvements and changes in earthquake monitoring. The development of these systems to not just say where an earthquake happened, but where was the shaking. That's what people need to know."
Below, a look at some of the technological changes, lessons learned and safety efforts in the wake of one of the United States' worst natural disasters.
Did you feel it?
The post-quake question so common, it became a vital tool for earthquake researchers. In 1994, the USGS "Did you feel it?" earthquake reporting page didn't exist. It wasn't until 1999 that the page was launched, giving people who felt the shaking a place to share their experience with the agency. And, although the feature wasn't around on Jan. 17, 1994, the USGS would still like to hear from anyone who felt shaking on that day.
The Great ShakeOut Drill
In 2008, an annual earthquake drill known as the Great ShakeOut began in Southern California to teach the basic safety technique of "drop, cover and hold on." Initially based on a scenario of a magnitude 7.8 quake on the southern end of the mighty San Andreas fault, the drill has since spread across the United States and around the world.
Mandatory retrofit ordinance
In 2015, Los Angeles enacted a mandatory retrofit ordinance aimed at preventing loss of life in major earthquakes at the city's most vulnerable buildings. It covered about 13,500 "soft-story" buildings like Northridge Meadows and some 1,500 buildings with "non-ductile reinforced concrete" construction. The ordinance, however, allowed a process spanning seven years for retrofitting of soft-story buildings and 25 years for non-ductile reinforced concrete buildings.
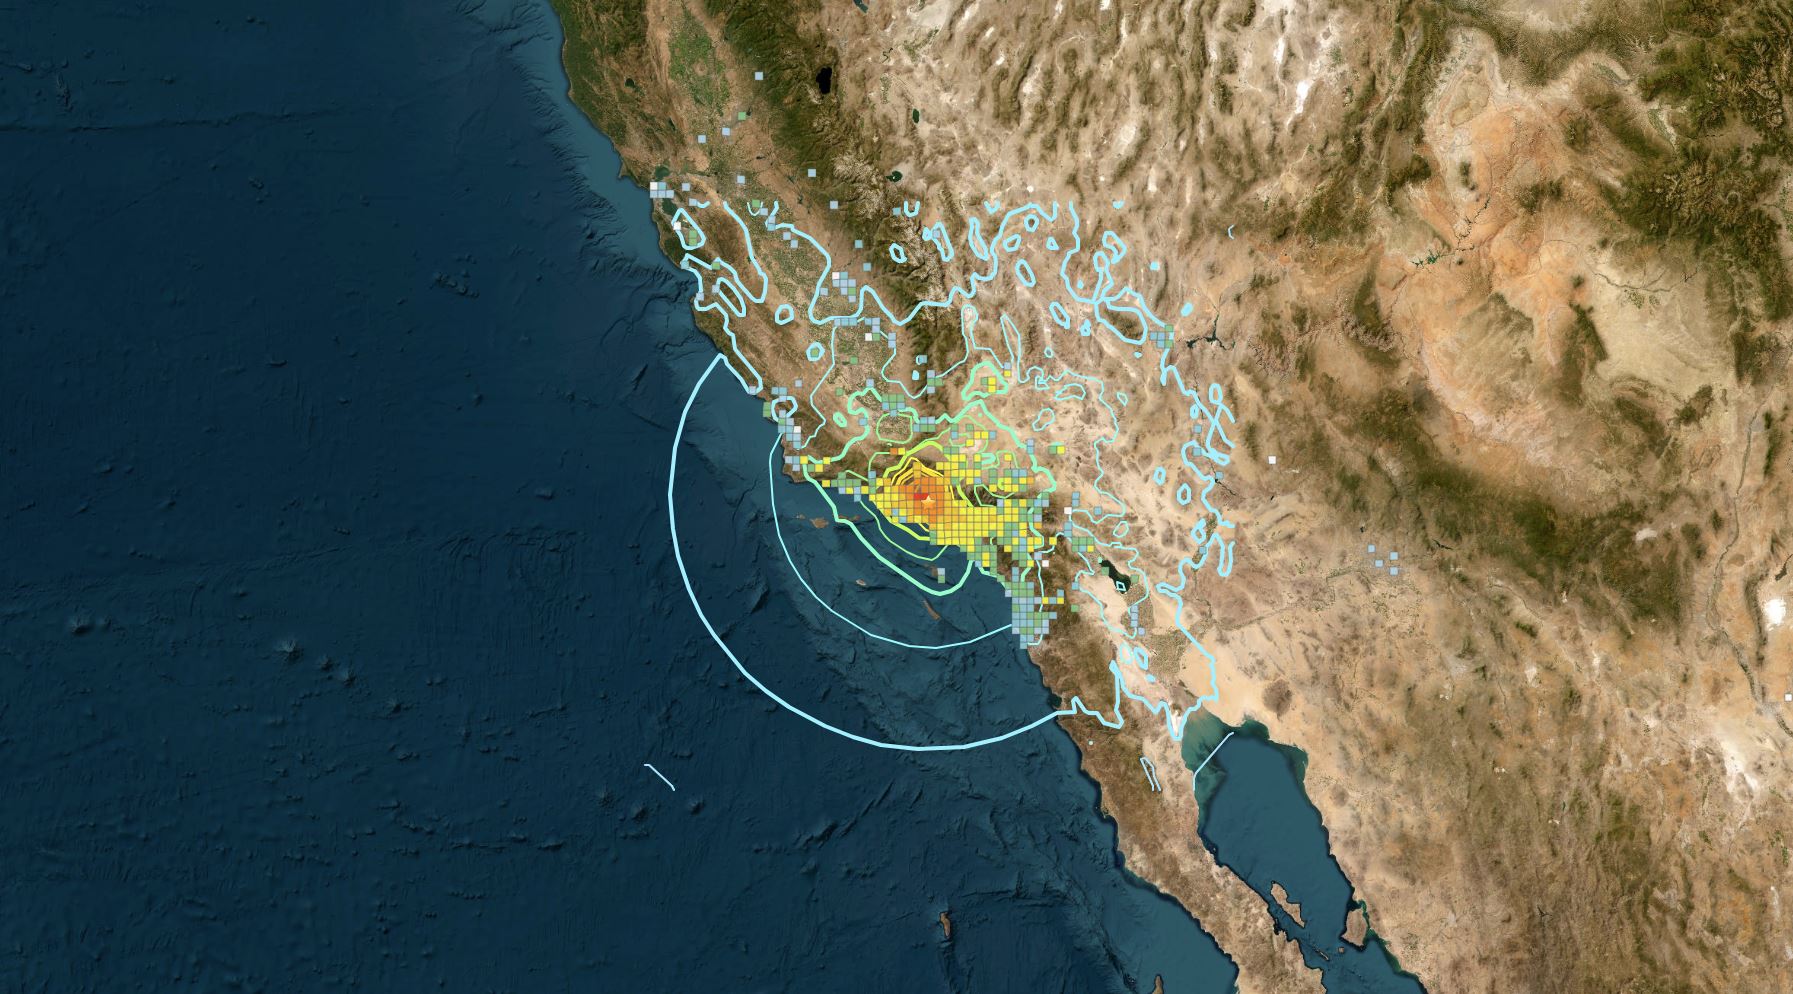
Seismic hazard models
Seismic hazard mapping has changed significantly since 1994. The maps help evaluate earthquake hazards and the risks they pose to parts of the United States. The more advanced models take what researchers know about earthquake sources, crust deformation, faults and ground shaking and help create seismic hazard maps used for seismic requirements in building codes and risk models for insurance rates.
Fault model evolution
Researchers are able to better document faults in the Los Angeles area -- what seismologist Dr. Lucy Jones called a "CAT scan" of the LA basin. The models allowed researchers to study the Oakridge fault, a larger fault that shows up in Ventura County.
"We could start seeing that Northridge wasn't just a localized little fault," Jones told NBC4 in a 2019 interview. "Up until Northridge, we would have said you couldn't have that big an earthquake on a blind fault -- that if it's a big enough fault to give you a big earthquake, it has to come all the way through to the service. We had to revise that idea."
Earthquake event pages
USGS earthquake event pages provide the public with critical information. They are a go-to resource with detailed information about individual earthquakes and answer the question on everyone's mind when we feel shaking: Was that an earthquake? The best place to go for an answer is this USGS map of latest earthquakes.
Early warning system
Earthquake early warning systems are designed to detect the start of an earthquake and send alerts that can give warnings ranging from several seconds to a minute before shaking arrives, depending on distance from the epicenter. That might not sound like much time, but those precious seconds can be enough time to slow trains, stop industrial processes and allow students in school classrooms to take cover under desks. The USGS ShakeAlert Earthquake Early Warning system relies on an extensive seismic monitoring network to warn of possible shaking.
"You can draw a line straight from Northridge to what we're doing with early warning," Jones said in a 2019 interview with NBCLA. "Because the system failed in Northridge, we got more money. Because of those problems, we got a chunk of money to improve those computers. We've sped it up to the point that sometimes the information will get to you before the shaking itself does, compared to months to get that information in 1995."
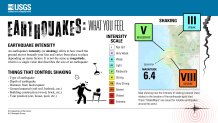
How earthquake shaking is measured
The word "magnitude" is often used to describe the size of an earthquake, but it doesn't take into account all factors that influence what we feel during an earthquake. The Modified Mercalli Intensity Scale (MMI) offers something more relatable depicted on a scale of intensity ranging from "Not felt" to "Extreme." Factors that control shaking include the type of earthquake, its depth, distance from the fault rupture, the type of ground material in the area, building construction and where you are at the time, such as in a house, car or swimming pool. MMIs are included on the USGS earthquake event pages.
Aftershock forecasting
Earthquakes and aftershocks can't be predicted, but seismologists can use statistical probabilities to provide a forecast -- an idea of what to expect after the main event. The USGS Aftershock Forecast wasn't around in 1994, but now it's available to the public on each USGS event page -- something that also wasn't available 30 years ago -- for quakes larger than mangnitude-5.0. The forecast offers the probability of small, medium and large earthquakes, and an idea of how many aftershocks to expect.
Other Digital Technology
In 2014, the Los Angeles Economic Development Corp. released a guide aimed at helping businesses minimize disruptions from major earthquakes, taking advantage of information technologies such as the digital cloud to keep a company working even if its physical systems are destroyed or inaccessible.